Best And Worst States For Finding Love After 50

Divorce is on the rise among Americans 50 and older, with the rate of divorces in the age group doubling in the past few decades as the Baby Boomer generation neared retirement age. And for those 65 and older, the rate tripled.

It would be easy to read that data as a bad thing, and, no doubt, it felt bad for everyone involved in all those divorces. But every ending is a chance for a new beginning, and for folks who find themselves single as their hair gets grayer and grayer, finding love again may not be as simple as swiping an app.

That’s because the older you get, the smaller the dating pool becomes. For instance, more than 60 percent of people between 55 and 64 are already married. When you add to that the financial struggles that, sadly, are becoming more common for people nearing or past retirement age, dating over 50 isn’t exactly on the front burner in many places across the country.

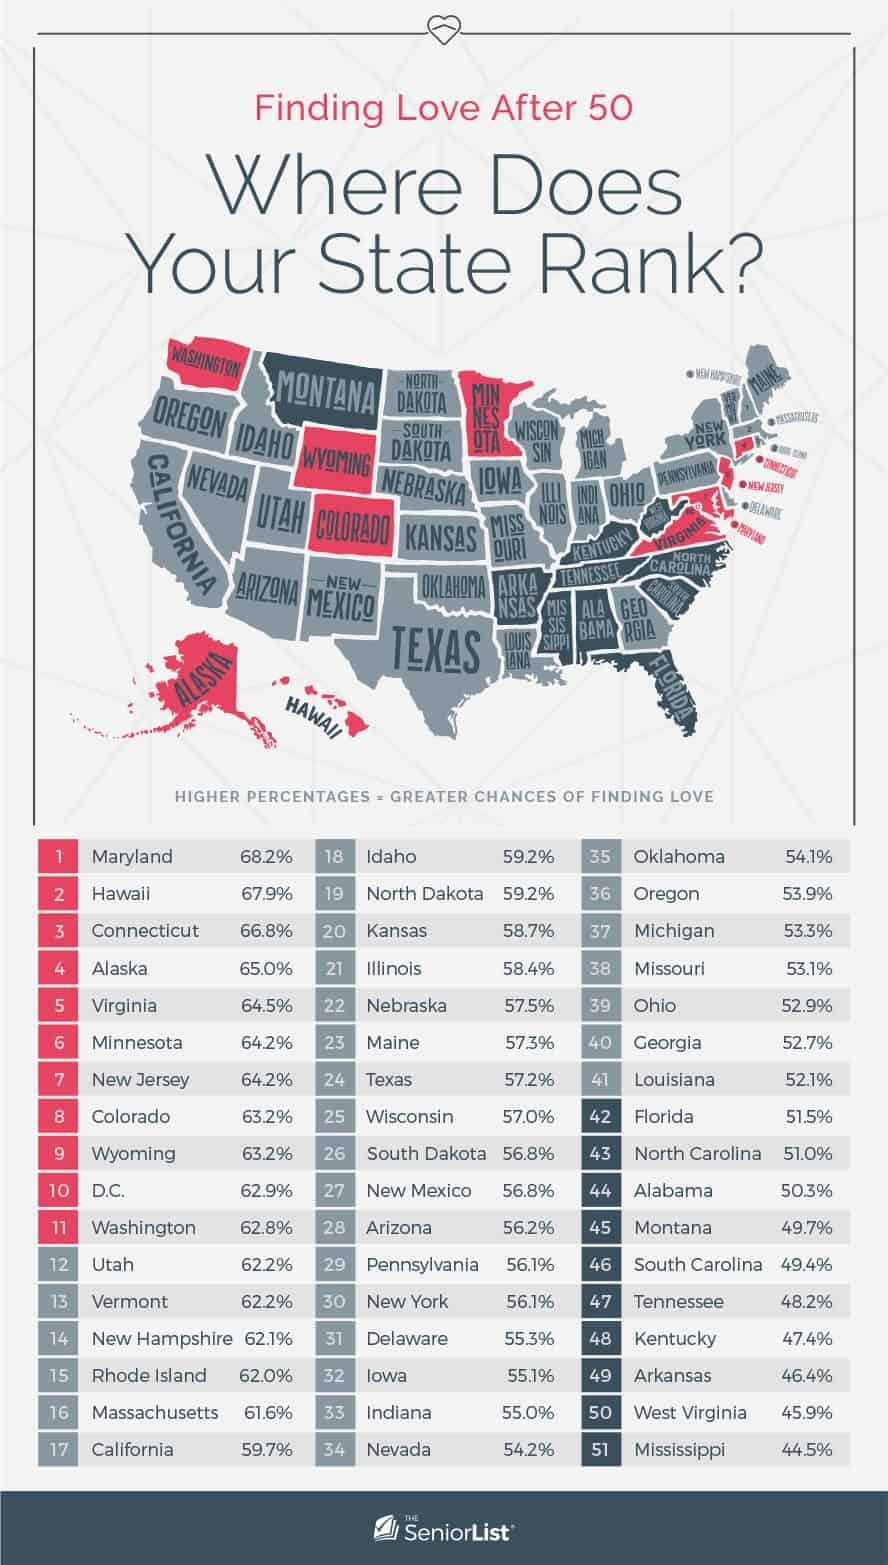
There’s good news, though, and several states look to be downright hotbeds for single seniors looking for love, according to our analysis. Let’s explore which states provide the best (and worst) chances of finding love after 50, and we’ll look at why those chances depend quite a bit on what you’re looking for.

Finding Love After 50, Where Does Your State Rank ?, WASHINGTON, NORTH, DAKOTA IDAHO, OREGON NEVADA, NEW, -SOUTH DAKOTA, WYOMING NEBRASKA, YORK, MICH, SIN, PENNSYLVANIA, UTAH COLORADO KANSAS, IFORNIA, KENTUCK, NORTH, CAROLINA, ARIZONA MEXICO, -NEW, _OKLAHOMA ARKA TENNESSEE, NSAS GEO, TEXAS, HAWAII, HIGHER PERCENTAGES GREATER CHANCES OF FINDING LOVE, 1, Maryland, 68.2 %, 18 Idaho, 59.2 %, 35, Oklahoma, 54.1 %, 2, Hawaii, 67.9 %, 19, North Dakota 59.2 %, 36, Oregon, 53.9 %, 3, Connecticut, 66.8 %, 20, Kansas, 58.7 %, 37, Michigan, 53.3 %, 4, Alaska, 65.0 %, 21, Illinois, 58.4, 38, Missouri, 53.1 %, 5, Virginia, 64.5 %, 22 Nebraska, 57.5 %, 39, Ohio, 52.9 %, 6, Minnesota, 64.2 %, 23, Maine, 57.3 %, 40, Georgia, 52.7, New Jersey, 64.2 %, 24, Texas, 57.2 %, 41, Louisiana, 52.1 %, 8, Colorado, 63.2 %, 25 Wisconsin, 57.0 %, 42, Florida, 51.5 %, 9, Wyoming, 63.2 %, 26 South Dakota 56.8 %, 43, North Carolina, 51.0 %, 10, D.C. 62.9 %, 27, New Mexico, 56.8 %, 44, Alabama, 50.3 %, 11, Washington, 28 Arizona, 56.2 %, 45, Montana, 49.7 %, 12, Utah, 62.2 %, 29 Pennsylvania, 56.1 %, 46, South Carolina 49.4 %, 13, Vermont, 30, New York, 56.1 %, 47 Tennessee, 48.2 %, 14, New Hampshire 62.1 %, 31, Delaware, 55.3 %, 48, Kentucky, 47.4 %, 15, Rhode Island, 62.0 %, 32 lowa, 55.1 %, 49, Arkansas, 46.4 %, 16, Massachusetts, 61.6 %, 33 Indiana, 55.0 %, 50, West Virginia, 45.9 %, 17, California, 59.7 %, 34, Nevada, 54.2 %, 51, Mississippi, 44.5 %, THE, SeniorList

Best (And Worst) States For Finding Love

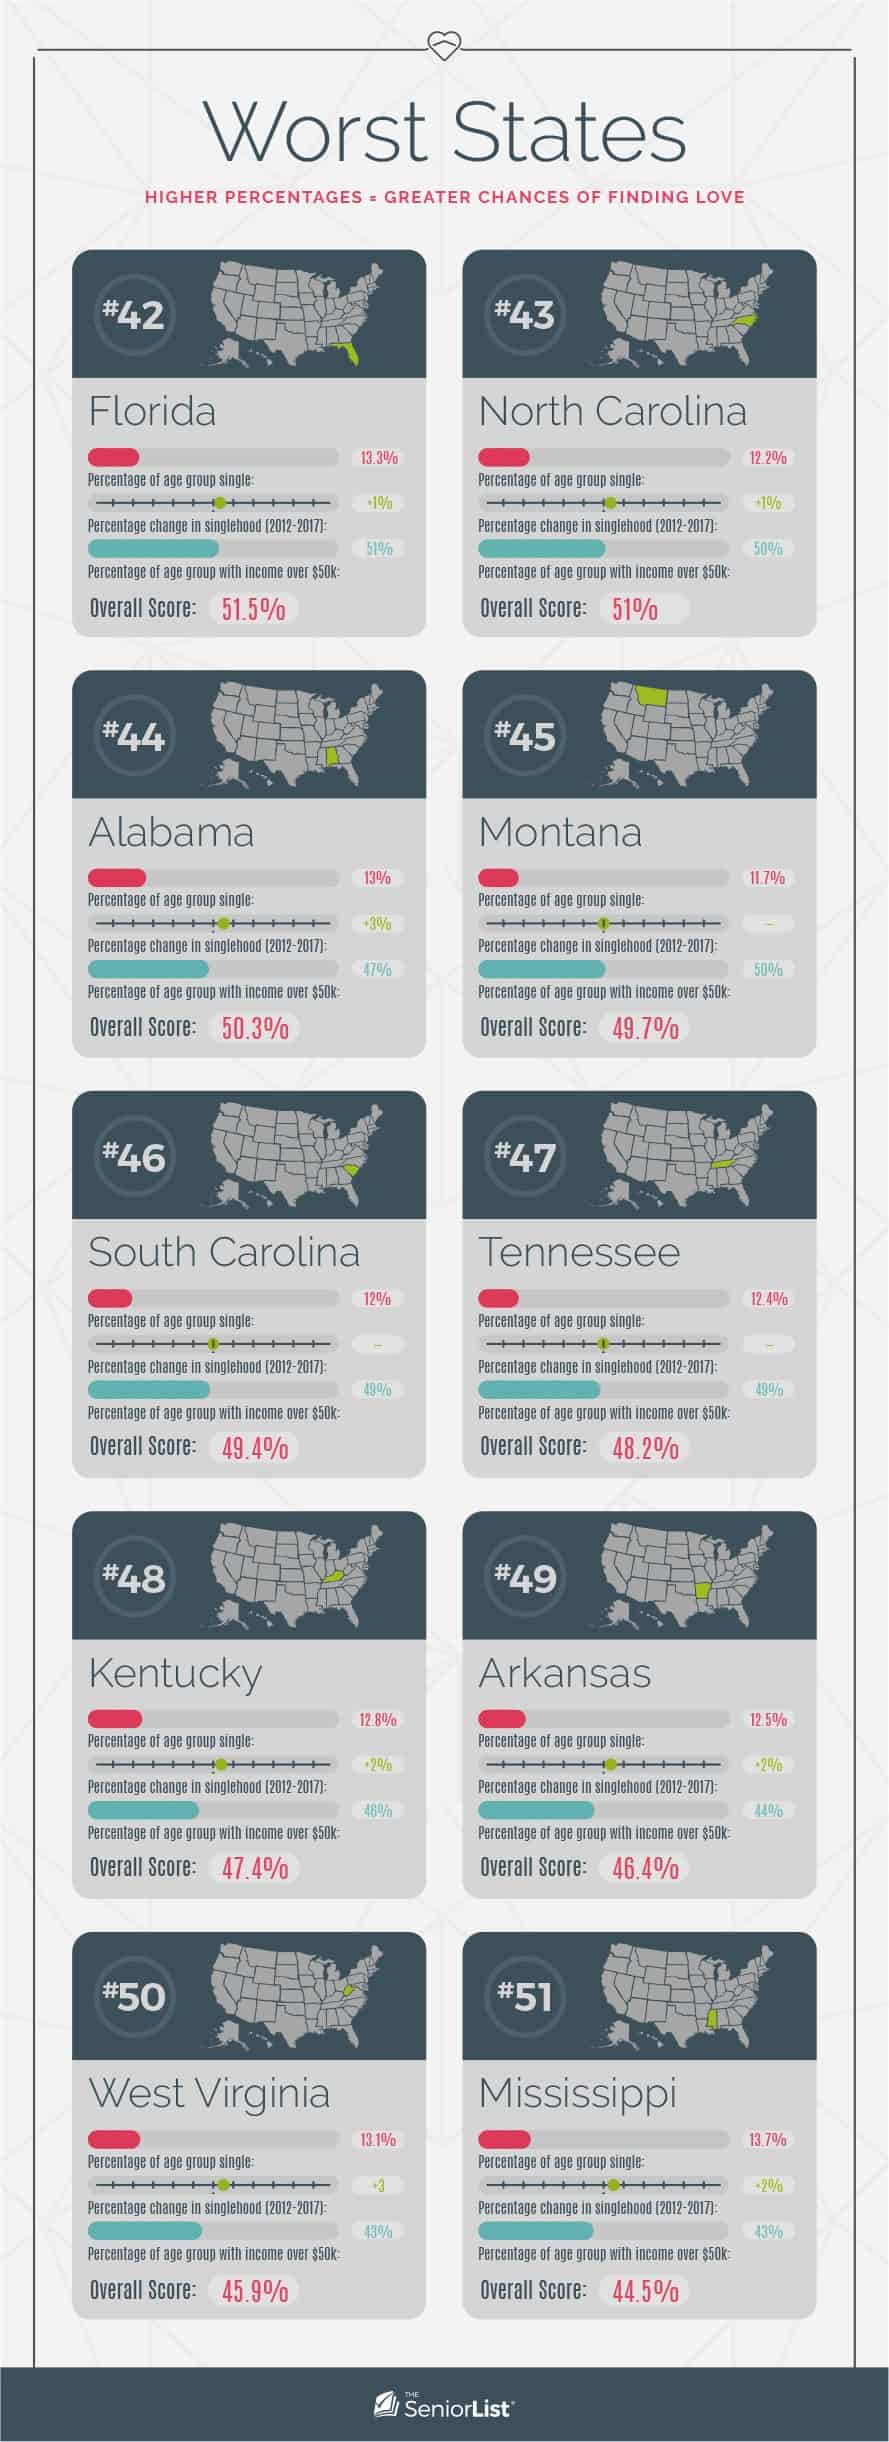
Let’s take a closer look at the best and worst states for finding love and why they ranked where they did.

Best States, HIGHER PERCENTAGES GREATER CHANCES OF FINDING LOVE, # 1, # 2, Maryland, Hawaii, 12.9 %, 12.9 %, Percentage of age group single :, Percentage of age group single Percentage change in singlehood ( 2012-2017 ), + 1 %, Percentage change in singlehood 2012-2017 ) :, 68 %, Percentage of age group with income over $ Overall Score : 68.2 %, Percentage of age group with income over $ 50k Overall Score : 67.9 %, # 3, Connecticut, Alaska, 13 %, 12.9, Percentage of age group single, Percentage of age group single :, + 2 %, Percentage change in 2012-2017 ), Percentage change in singlehood ( 2012-2017 ) :, 65 %, 69 %, Percentage of age group with income over $ 50k Overall Score : 66.8 %, Percentage of age group with income over $ Overall Score : 65 %, # 5, # 6, Virginia, 12 %, 11.6 %, Percentage of age group single :, +2, Percentage of age group single :, + 4, Percentage change in singlehood ( 2012-2017 ), 63 %, 61 %, Percentage of age group with income over $, Percentage of age group with income over $ 50k Overall Score : 64.2 %, Overall Score : 64.5 %, # 6, New Jersey with, Colorado with Wyoming, 12.3, 12.2, Percentage of age group single, Percentage of age group single, -1 %, Percentage change in singlehood ( 2012-2017 ), Percentage change in singlehood ( 2012-2017 ) :, 65 %, 62 %, Percentage of age group with income over $ Overall Score : 64.2 %, Percentage of age group with income over $ Overall Score : 63.2 %, # 7, # 8, Wyoming, with Colorado, D.C. 20.6 %, Percentage of age group single, Percentage of age group single :, + 4 %, Percentage change in singlehood ( 2012-2017 ), 57 %, 59 %, Percentage of age group with income over $ Overall Score : 63.2 %, Percentage of age group with income over $ Overall Score : 62.9, #, Washington, Utah tied with Vermont, 12.4 %, 9.8 %, Percentage of age group single, + 1, Percentage of age group single Percentage change in singlehood ( 2012-2017 ) :, -1 %, Percentage change in singlehood ( 2012-2017 ), 61 %, 63 %, Percentage of age group with income over $ Overall Score : 62.8, Percentage of age group with income over $ 50k Overall Score : 62.2 %, # 10, Vermont ( tied with, 12.9 %, Percentage of age group single, Percentage change in singlehood ( 2012-2017 ), 55 %, Percentage of age group with income over $ Overall Score : 62.2 %, SeniorList
Worst States, HIGHER PERCENTAGES = GREATER CHANCES OF FINDING LOVE, # 42, # 43, Florida, North Carolina, 13.3 %, 12.2 %, Percentage of age group single, Percentage of age group single :, + 1, Percentage change in singlehood ( 2012-2017 ), Percentage change in singlehood ( 2012-2017 ) :, 51 %, 50 %, Percentage of age group with income over $ Overall Score : 51.5 %, Percentage of age group with income over $ Overall Score : 51 %, # 44, # 45, Alabama, Montana, 13 %, 11.7, Percentage of age group, Percentage of age group single :, + 3 %, Percentage change in singlehood ( 2012-2017 ) :, Percentage change in singlehood ( 2012-2017 ) :, 47 %, 50 %, Percentage of age group with income over $ 50k Overall Score : 50.3 %, Percentage of age group with income over $ Overall Score : 49.7 %, # 46, # 47, South Carolina, Tennessee, 1.4 %, Percentage of age group single :, 1 %, Percentage of age group with income over $ Overall Score : 49.4 %, Percentage of age group with income over $ Overall Score : 48.2 %, # 48, # 49, Kentucky, Arkansas, 12.8 %, 12.5 %, Percentage of age group single, Percentage of age group single, + 2 %, Percentage change in singlehood ( 2012-2017 ) :, 46 %, 44 %, Percentage of age group with income over $ Overall Score : 47.4 %, Percentage of age group with income over $ Overall Score : 46.4 %, # 50, # 51, West Virginia, Mississippi, 13.1 %, Percentage of age group single, Percentage of age group single, + 2 %, Percentage change in singlehood ( 2012-2017 ) :, Percentage change in singlehood 2012-2017 ) :, 1 %, Percentage of age group with income over $ Overall Score : 45.9 %, Percentage of age group with income over $ 50k Overall Score : 44.5 %, SeniorList

But Really, It Depends On What You’re Looking For

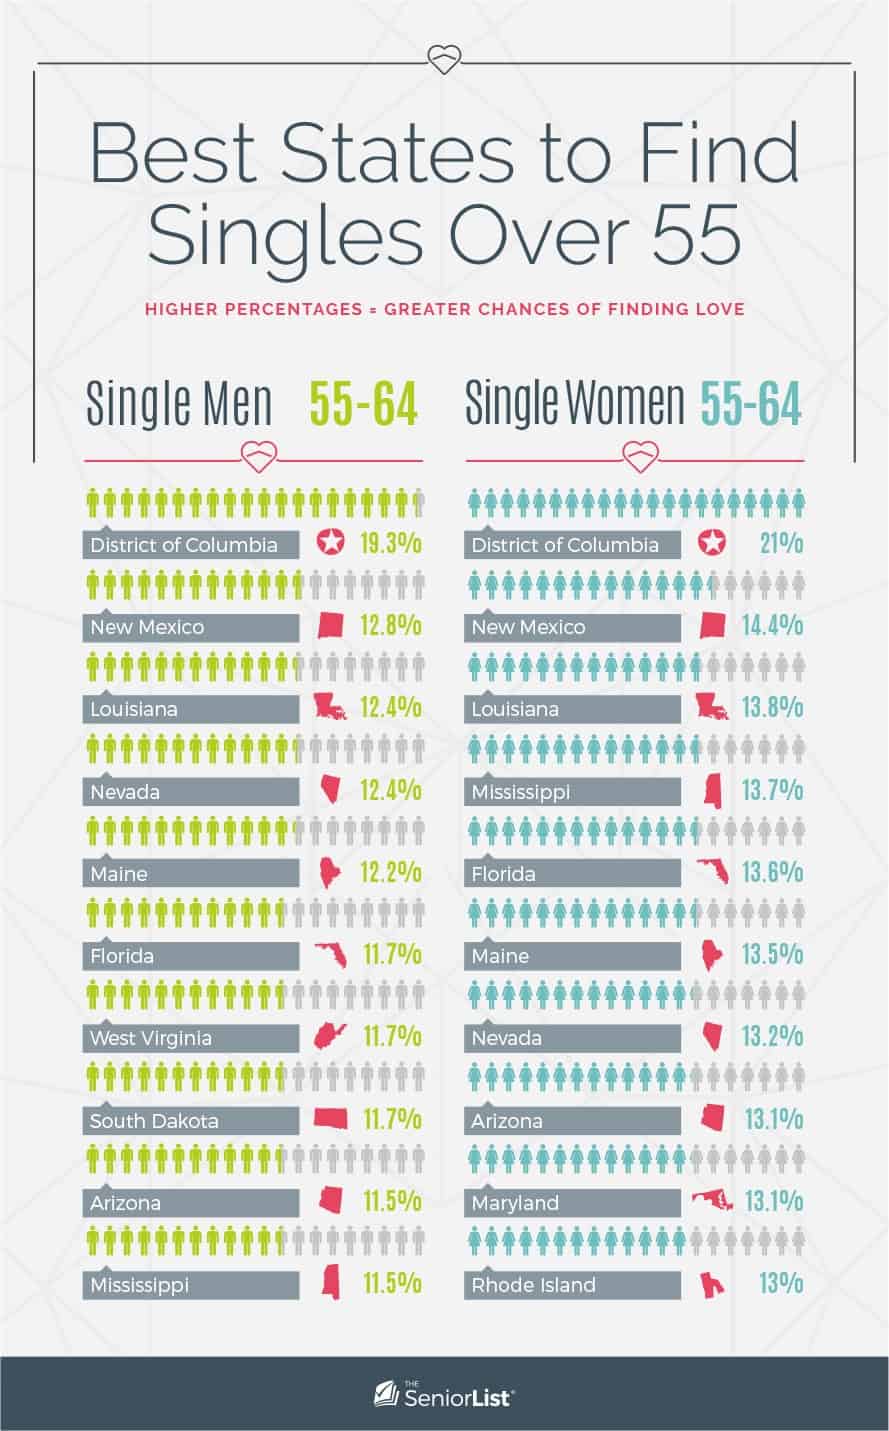
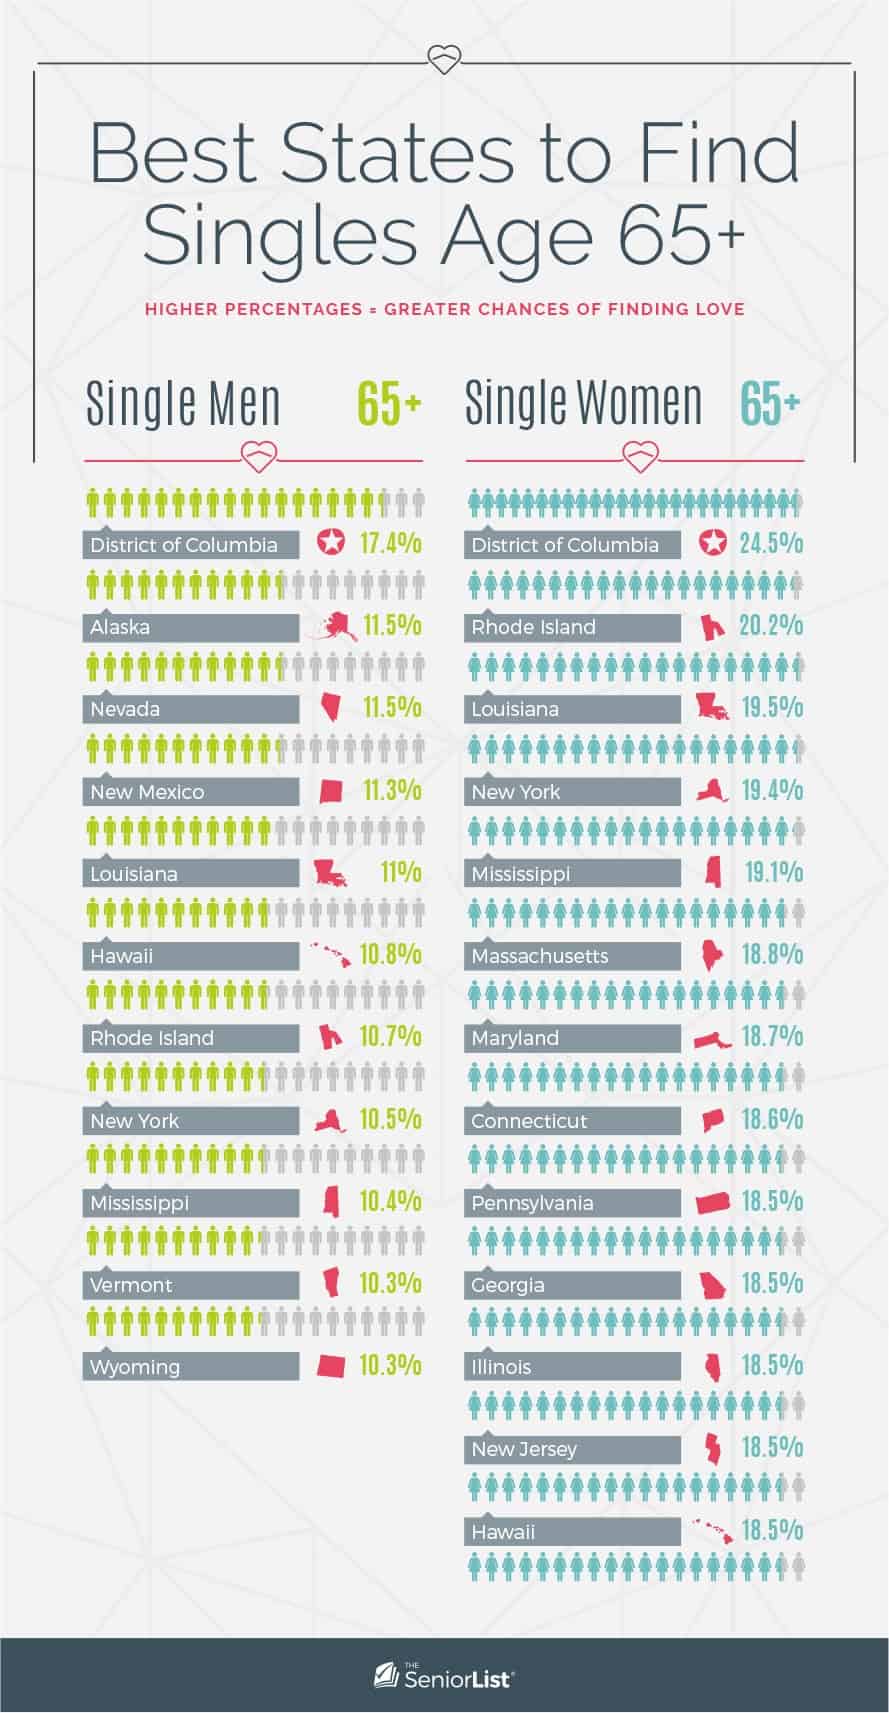
If you’re looking for a single woman over 50, you’ll likely have much more luck than if you’re looking for a single older man. The reason, well, that’s a bummer. American women, on average, live about 3 years longer than their male counterparts.

So let’s take a look at the best states to find single men and single women over 55:


Conclusion

Study after study has shown that meaningful social connections can make for a longer, better and happier life. In fact, one study compared the lack of strong relationships to smoking almost a pack of cigarettes per day.

That’s why it’s so important for those who find themselves single late in life to take their situation seriously and look for love, even if it is harder than it might be for your kids or grandkids. Because it’s never too late to find your happily ever after.

About This Analysis

We used the Census Bureau’s American FactFinder tool to build customized datasets covering state-level and national data on marriage and income.

Marriage: We wanted to know how many people in each age group were single — and ready to mingle — so we included those divorced, widowed or never married but excluded those who were married but separated, as well as calculating the marriage trends over time in each state. The age group we examined were individuals over 55 years old.

Income: Dating can be expensive, so we compared the marriage data with median income information to create our ranking of states where the senior singles dating market is the strongest. Because of the way national median income figures are reported, this group was slightly larger and included individuals 45 and older.

The overall percentages are a simple comparison of the trends toward singlehood and income, as the figures tell us whether the state is growing or contracting when it comes to single seniors and how many seniors are likely to be up for dating based on their income level. Note the final numbers were rounded for ease of comparison.

Fair Use Statement

The material on this page is free to share for noncommercial use. When using the text or images from this page, all we ask is that you properly attribute it with a link back to the URL of this page.