Which States are Safest for Seniors?
Most of us would like to imagine our golden years will be filled with safety (beyond the use of a PERS), financial security and relaxation. And no doubt, the 50 million Americans who are 65 and older today are hoping for the same.
But the sad fact is millions of older Americans can’t sit back and take it easy. Whether they’re still working (almost 20 percent of those retirement age and older haven’t yet retired), or they’re living in poverty, or they’re targets of fraud and violence, far too many of our oldest citizens are dealing with unsafe conditions.
Did You Know: A medical alert device can provide quick access to first-responders? To find the right system for your needs, read our rundown of the best medical alert systems.
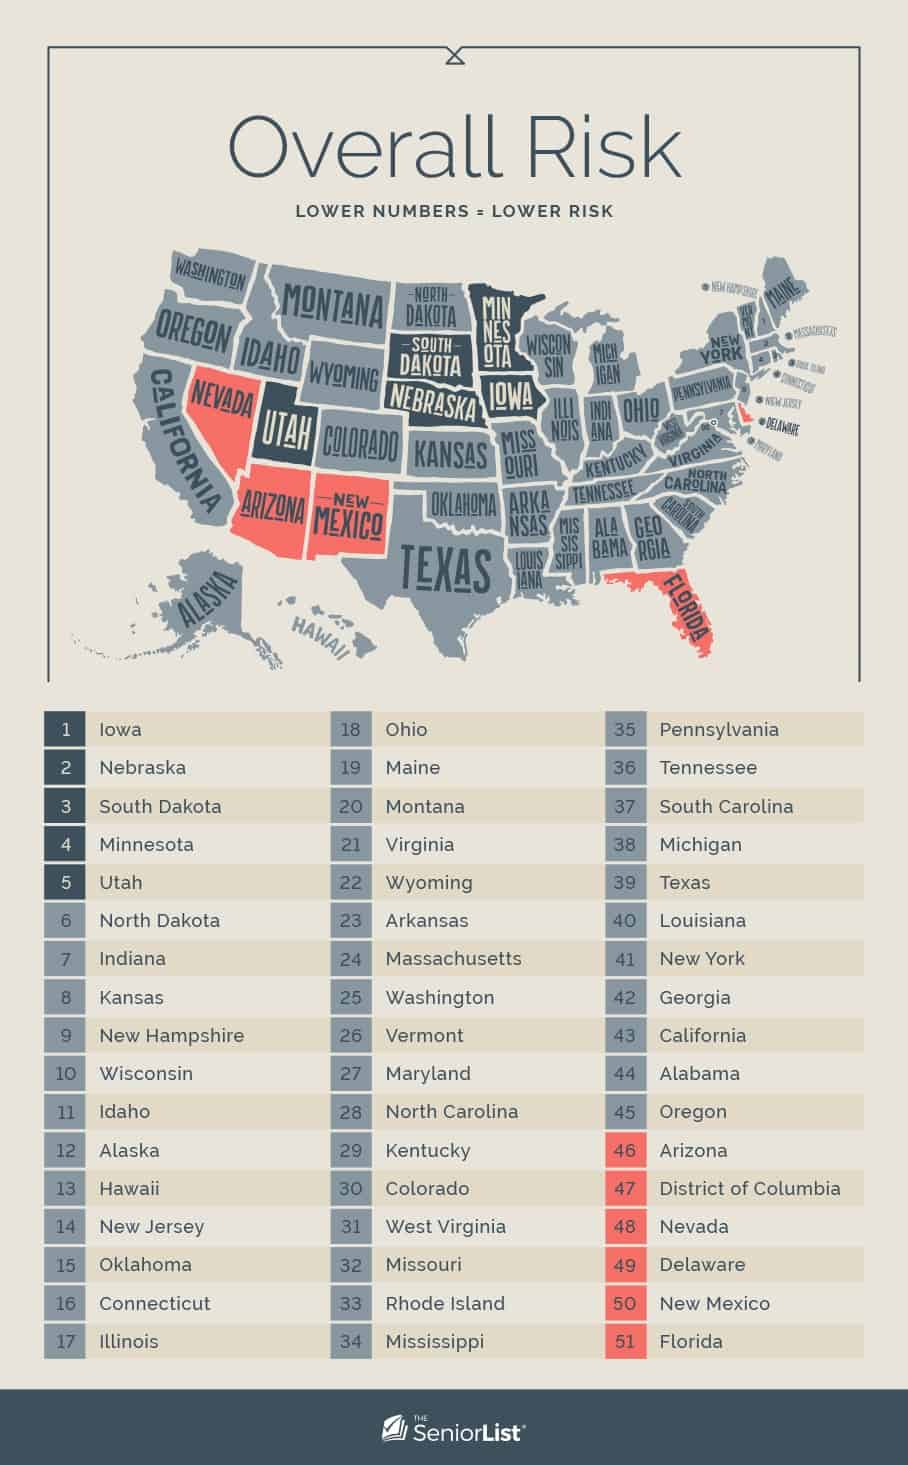
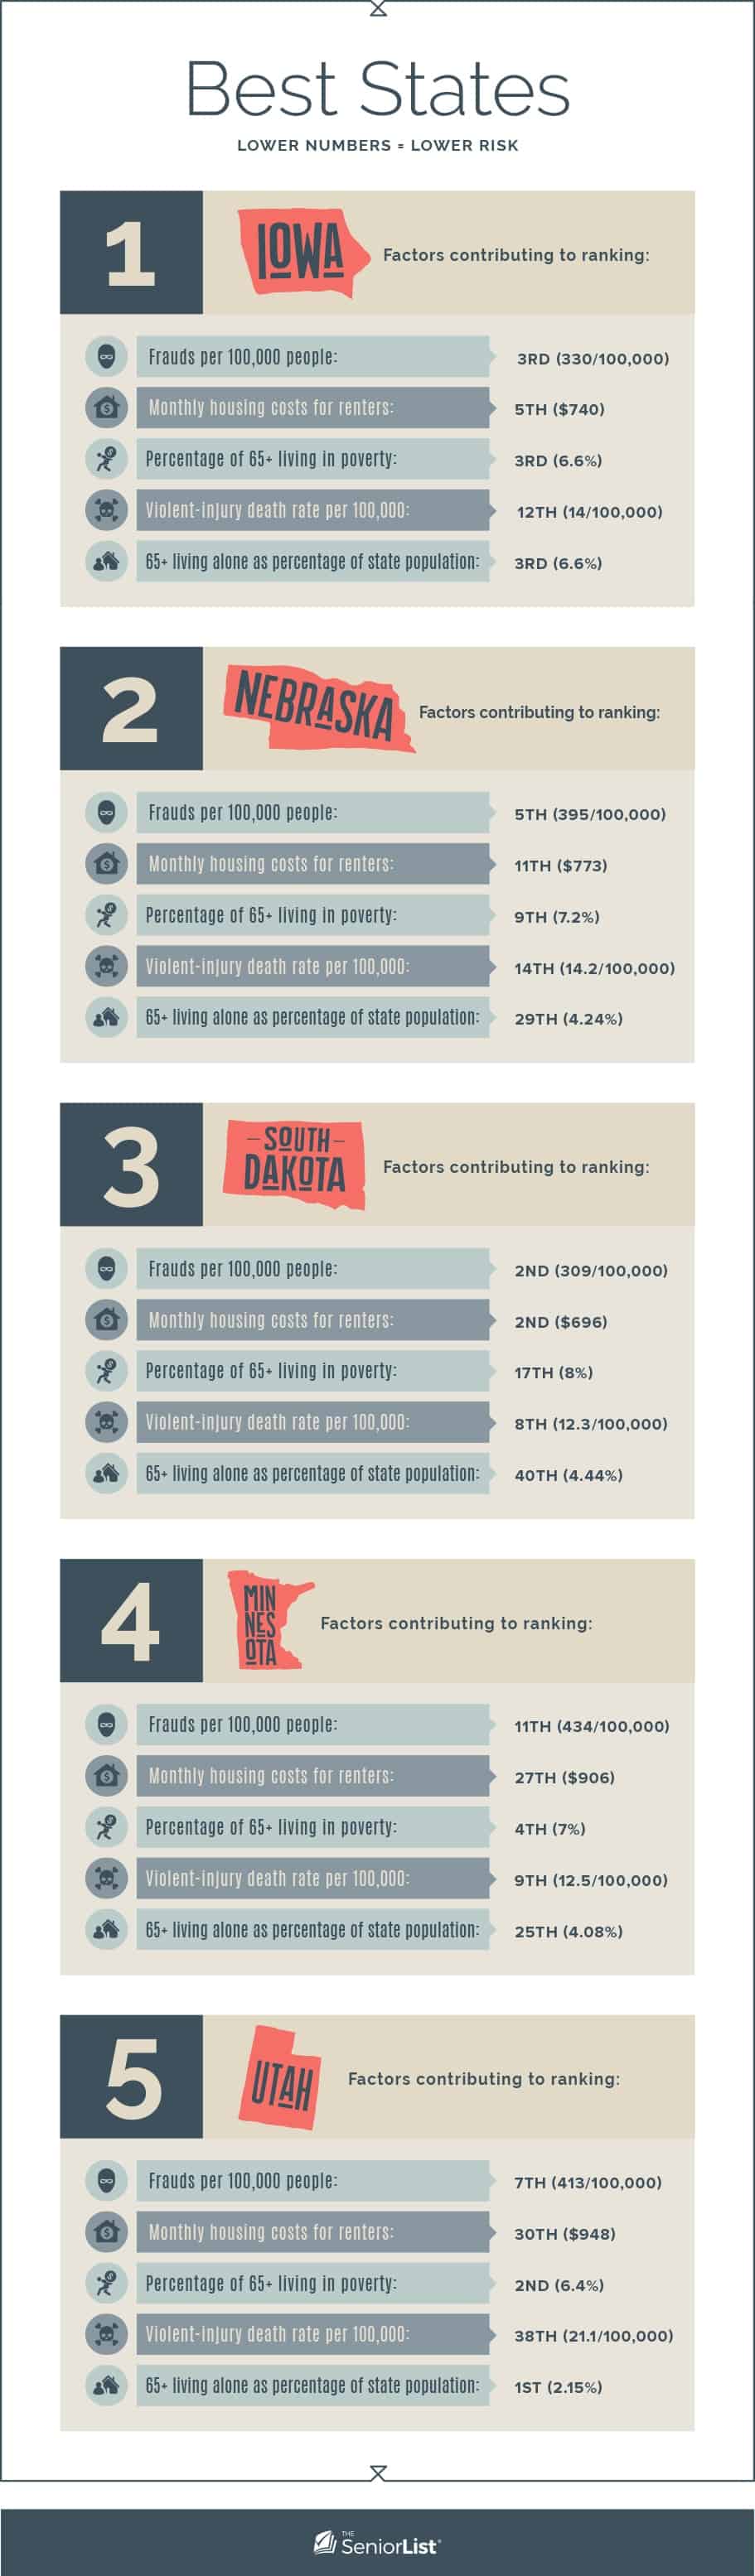
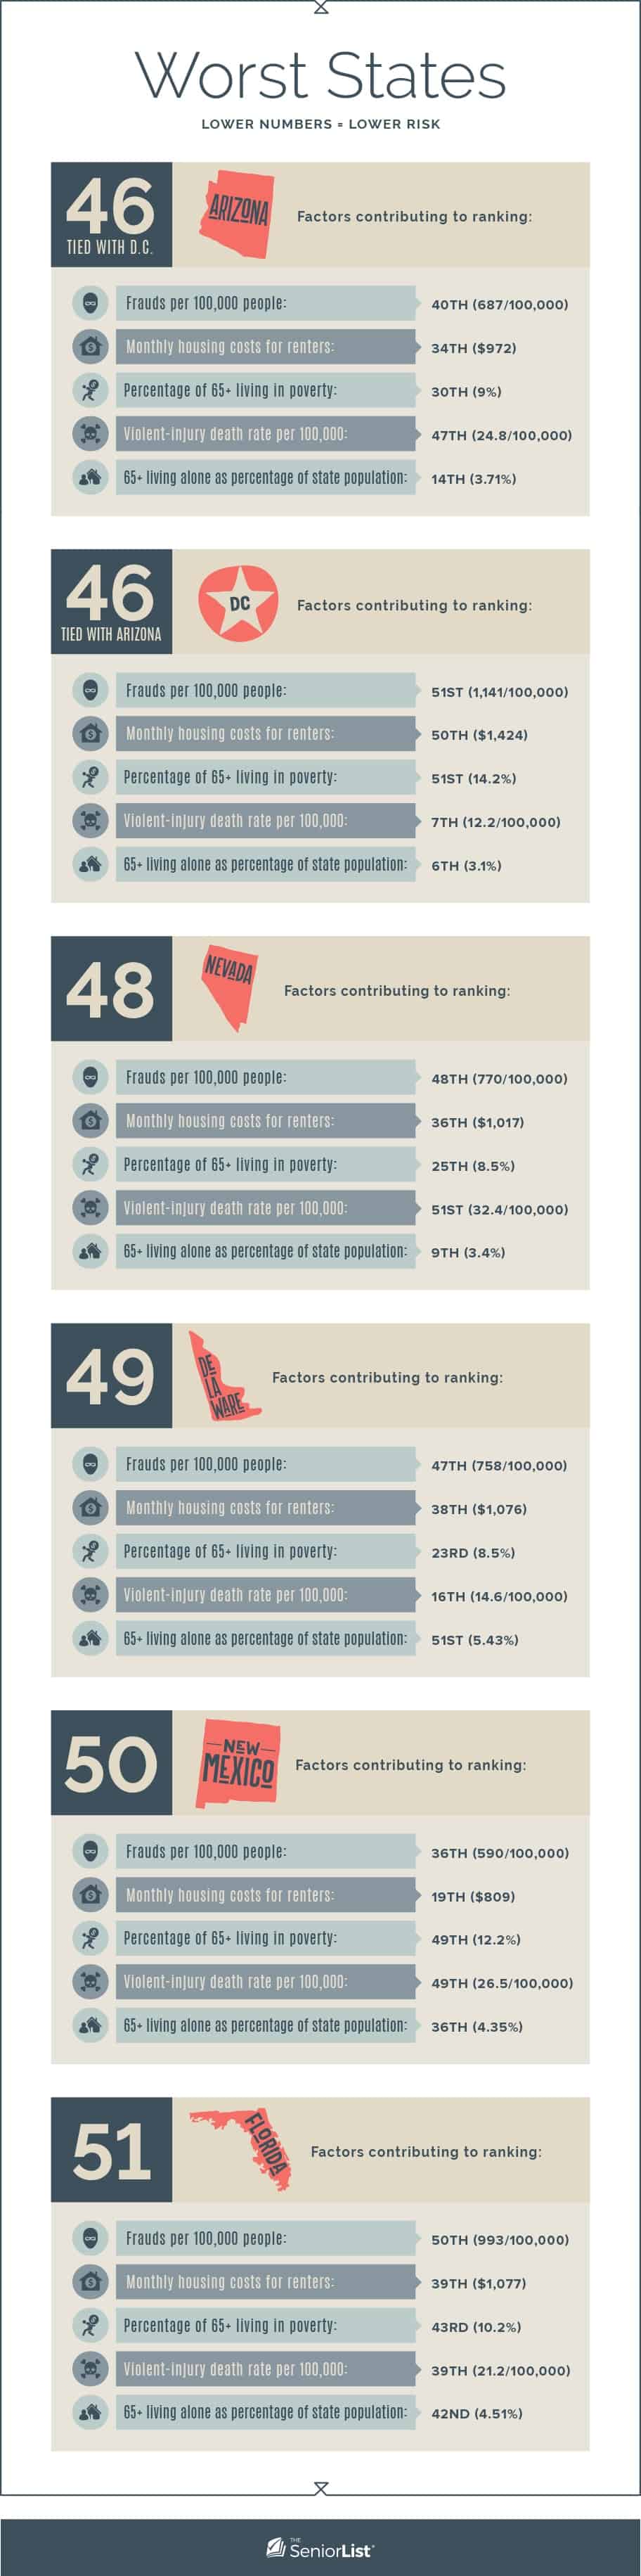
Iowa was determined to be the best for senior citizens in our ranking, while, pretty ironically, Florida posed the greatest risk to seniors. The map above shows where each state falls on the risk spectrum, but let’s dig a little deeper into the numbers and rankings for the best and worst states:
Inside the Numbers
Let’s take a national-level view at the five areas we studied:
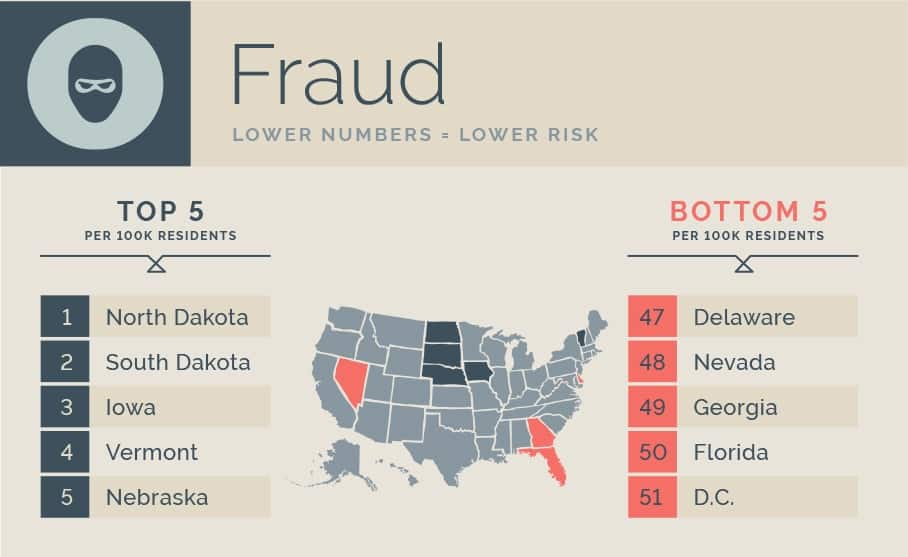
The most recent rate of frauds reported in each state per 100,000 people. North Dakota had the lowest rate at 277 per 100,000 and D.C. had the highest rate at 1,141 per 100,000. Nationwide, the average was 559 per 100,000.
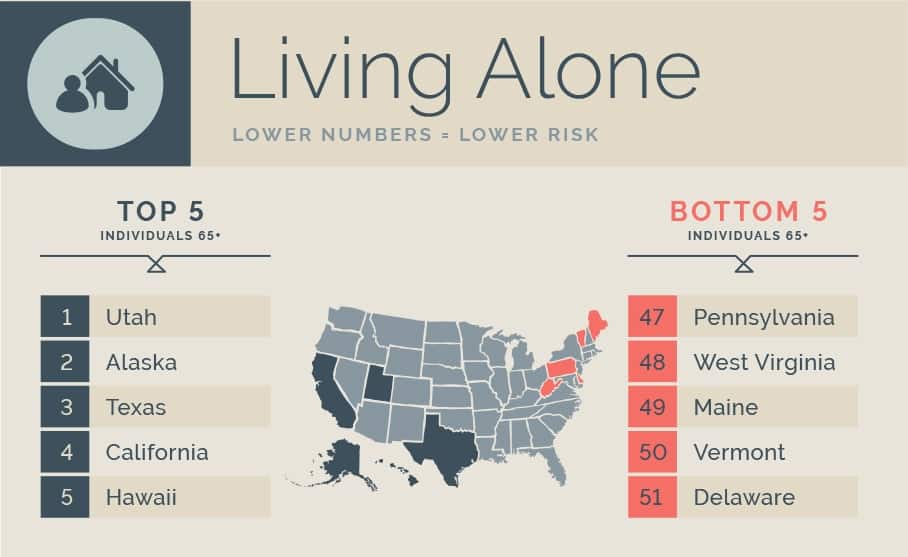
Individuals 65 and older living alone as a percentage of the state’s overall population. Nationwide, an average of about 4% of older Americans live alone. Utah had the lowest rate at 2.15%, and Delaware had the highest at 5.4%.
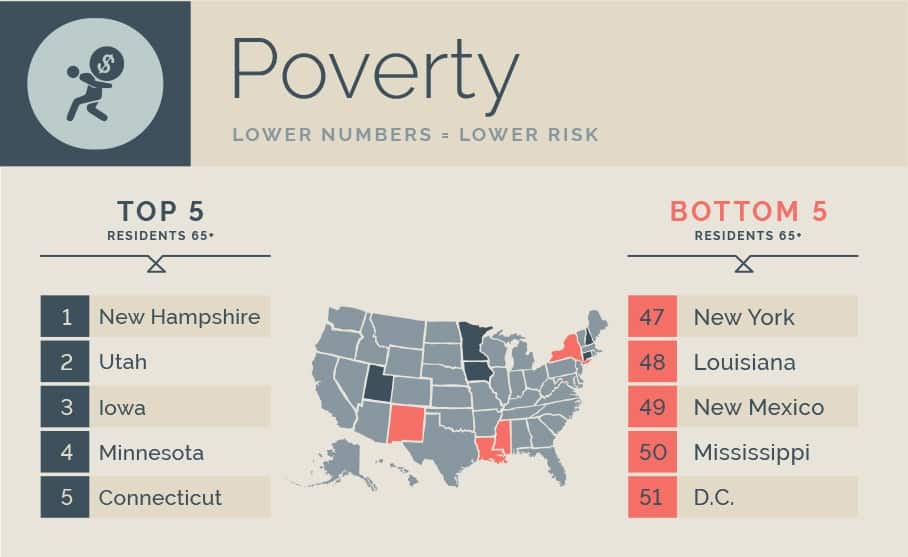
Percentage of residents 65 and older who live below the poverty line. The national average of the states’ rates is about 8.8%, while New Hampshire’s 5.8% was the lowest and D.C.’s 14.2% was the highest.
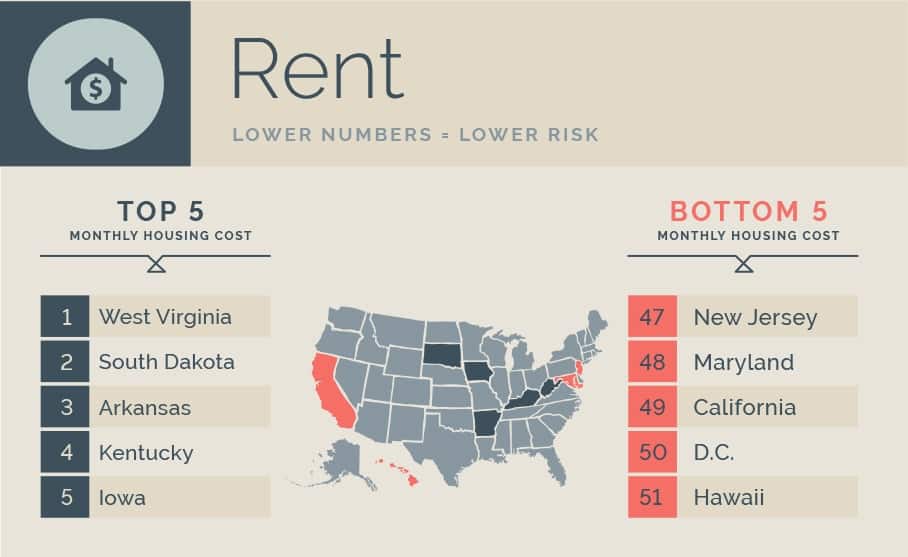
Total monthly housing costs for renter-occupied homes. West Virginia’s monthly cost of $681 was the lowest in the nation, while Hawaii’s $1,507 was the highest. The national median was $982.
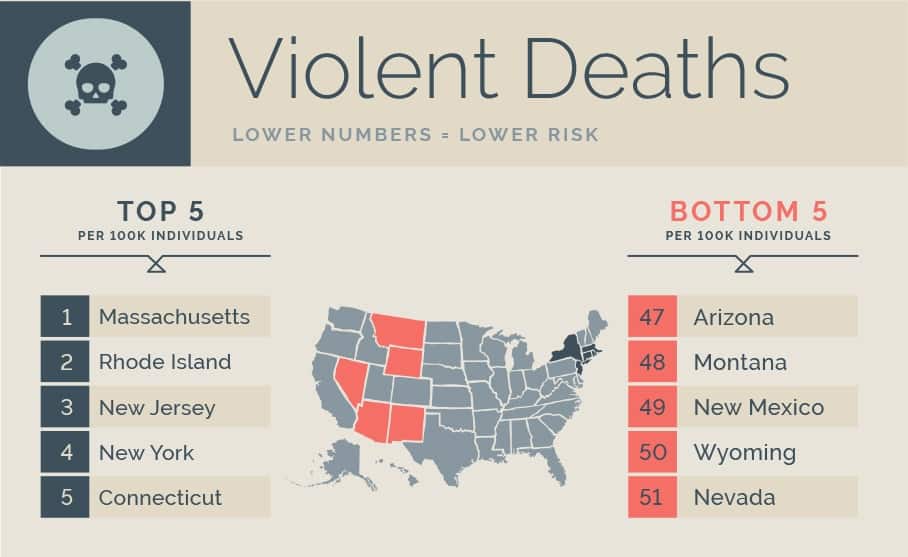
The average annual rate per 100,000 population of individuals 65 and older who have suffered a violent death. The national average is about 18 per 100,000, while Massachusetts had the lowest per-100,000 rate at 8.5 and Nevada had the highest rate at 32.3 per 100,000.
Tip: A modern home security system is a reliable and affordable way to keep your home safe. Read our guide to the best home security for seniors to learn more.
Methodology
Our analysis looked at five key factors affecting Americans 65 and older — fraud victimization, violent deaths, living alone, median rental costs and poverty. Each state (and the District of Columbia) was ranked and a corresponding number (1-51) was assigned based on that ranking. Each state’s ranking in each category was then added to create the overall risk ranking. Lower numbers mean states present less risk to seniors in these categories, and higher numbers equal higher risk.
Here’s what we measured:
- Frauds reported per 100,000 population
- Monthly housing costs for renter-occupied housing
- Percentage of 65+ population living in poverty
- Average annual rate of violent-injury death among 65+ population per 100,000 people
- 65+ population living alone as percentage of state’s overall population
Fair Use Statement
The material on this page is free to share for noncommercial use. When using the text or images from this page, we ask that you properly attribute it with a link back to the URL.